
OUR SERVICES & APPLICATIONS
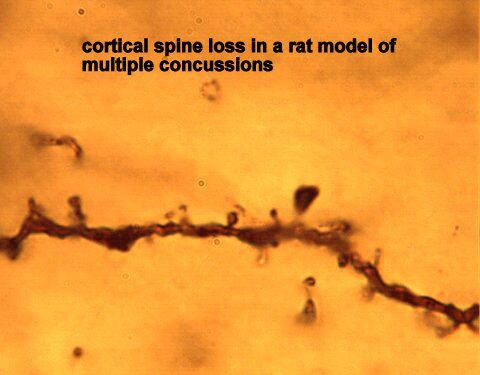
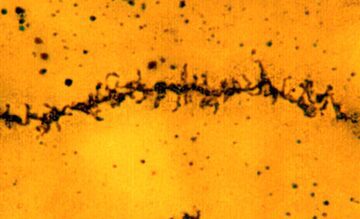
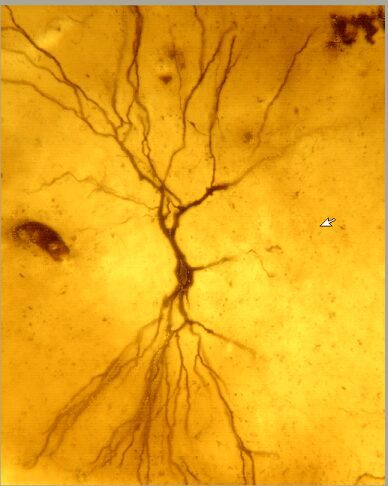
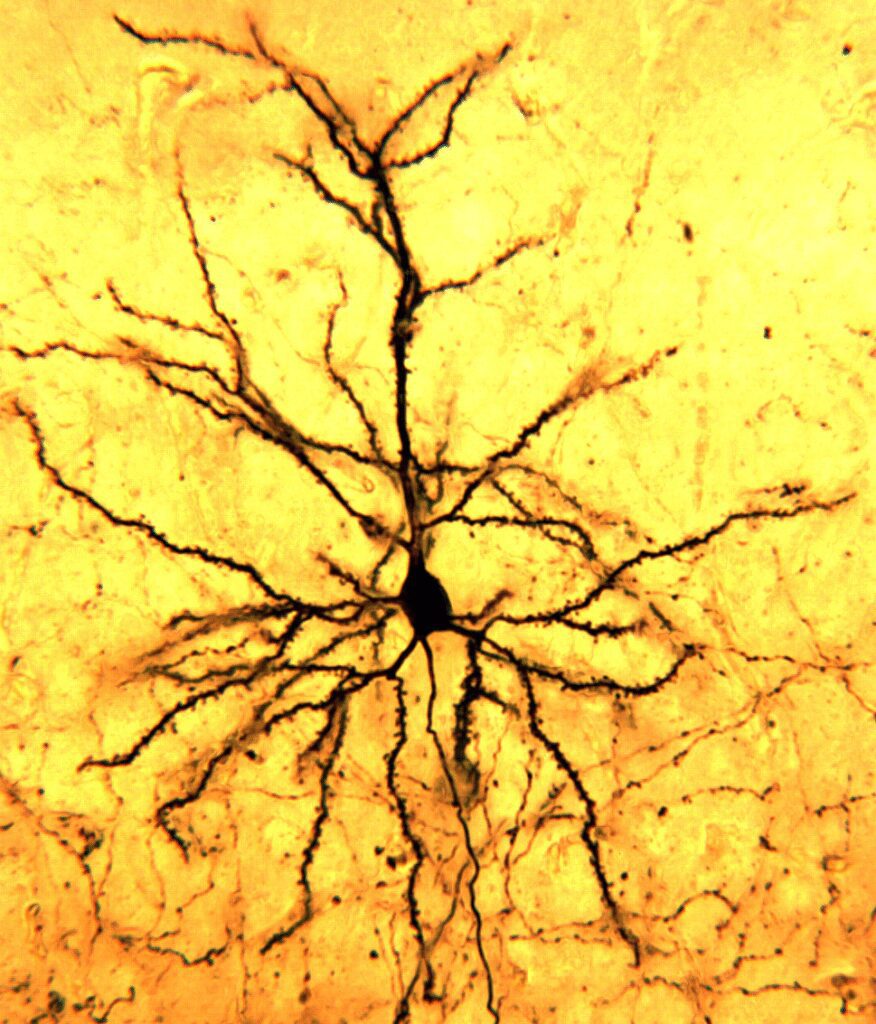
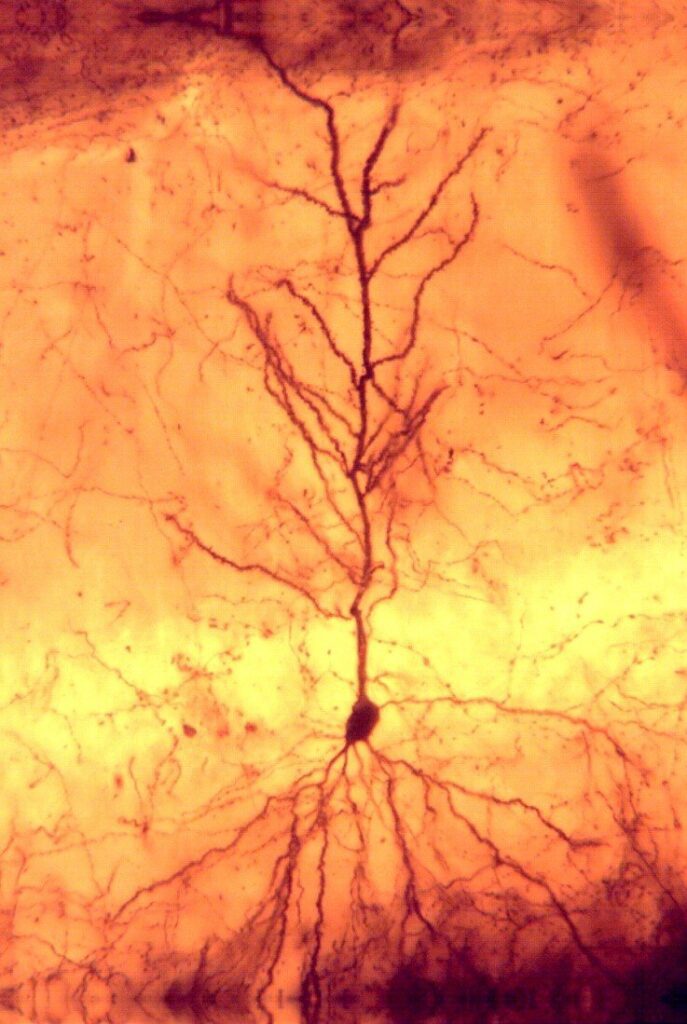
Integrating neuronal dendritic and synaptic morphology with advanced analytics to illuminate the brain’s neuroresilience and vulnerability.
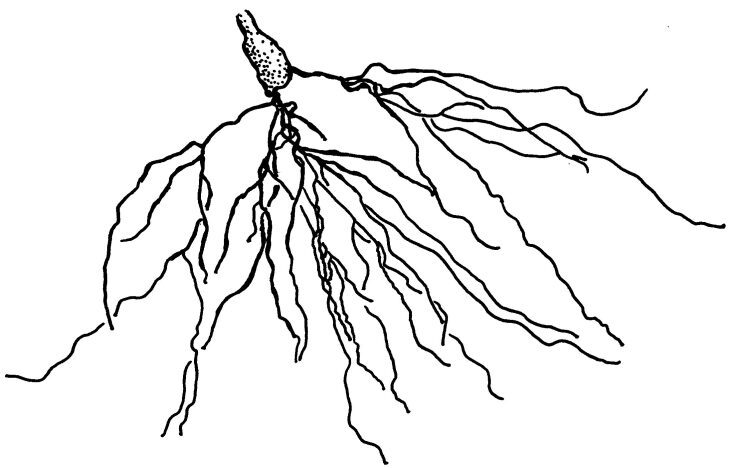
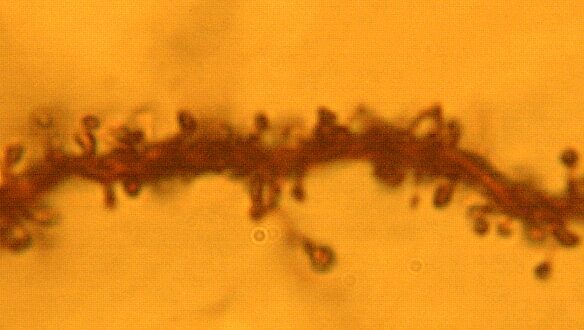
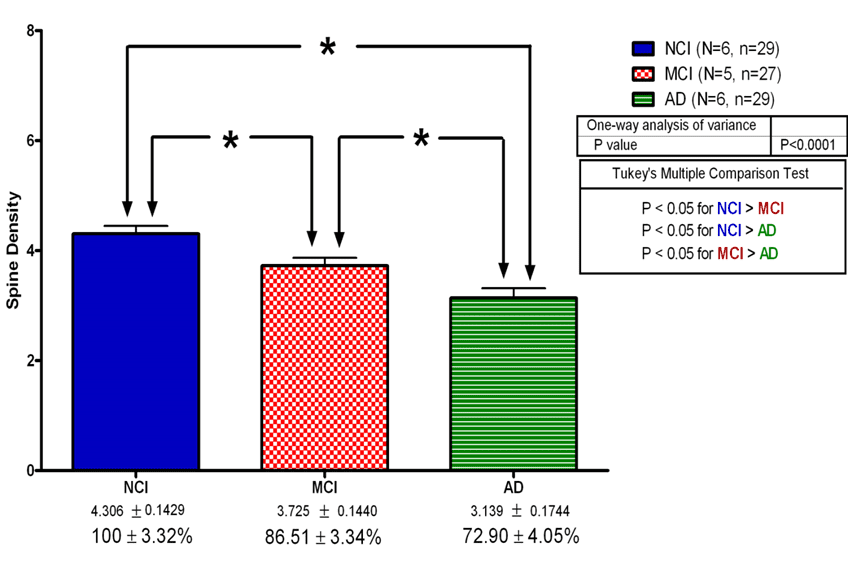
Normal Aging (Non-Cognitively Impaired
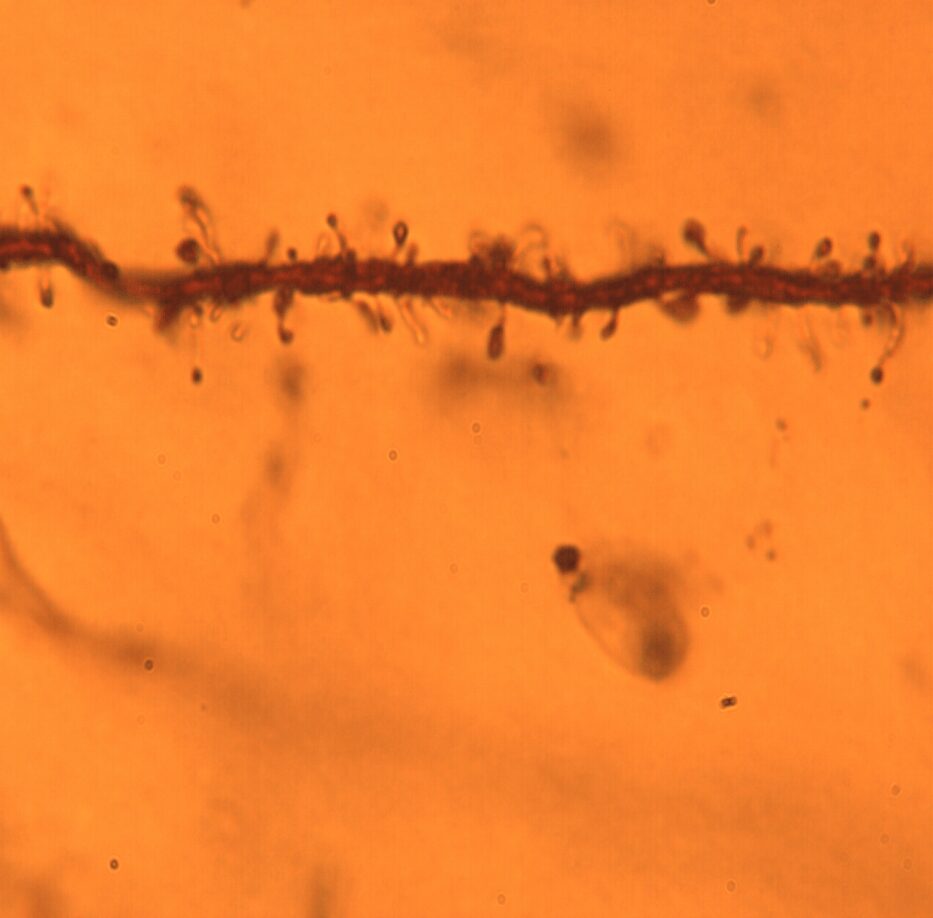
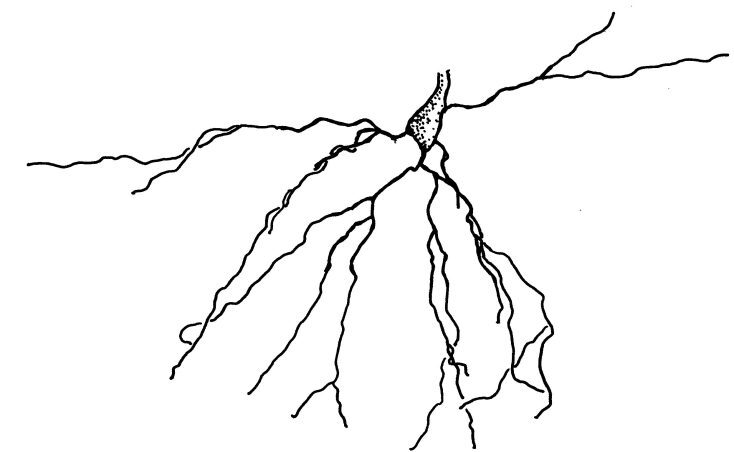
Mild Cognitive Impairment (MCI)
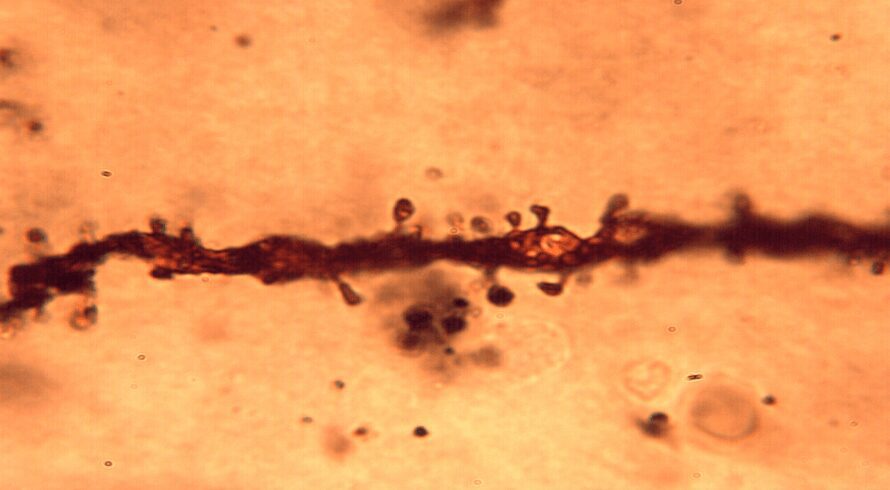
Alzheimer’s Disease